
import pandas as pd
retail = pd.read_csv('/content/drive/MyDrive/KDT/데이터분석/데이터/OnlineRetail.csv')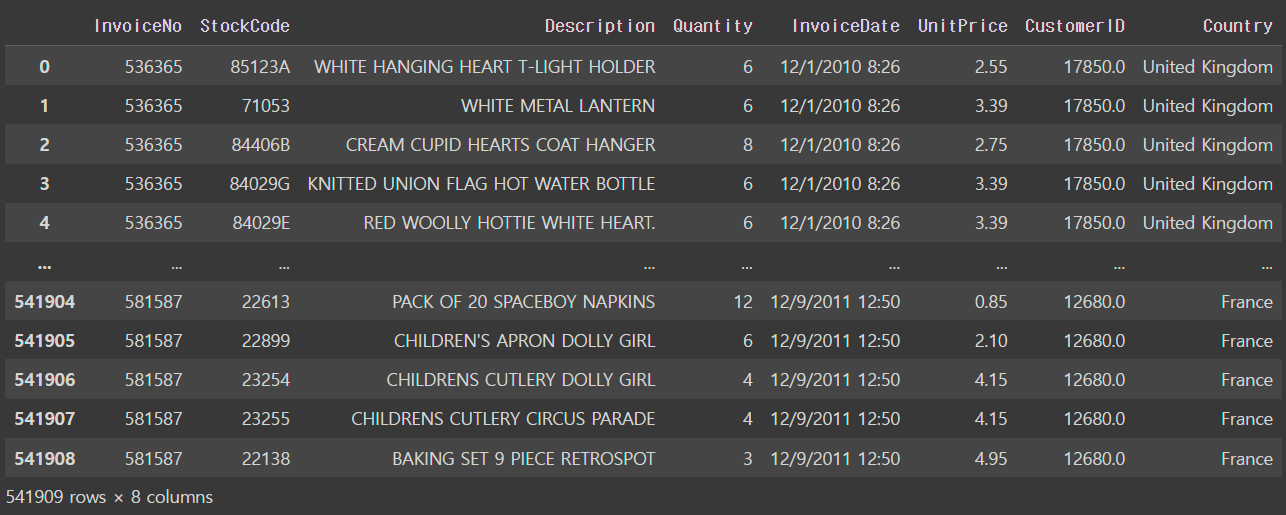
# 출력 row 갯수 설정
pd.options.display.max_rows = 6
=> 컬럼이 6개만 표출됨- .info() : 정보 보기
retail.info()

<class 'pandas.core.frame.DataFrame'>
RangeIndex: 541909 entries, 0 to 541908
Data columns (total 8 columns):
 #   Column       Non-Null Count   Dtype
---  ------       --------------   -----
 0   InvoiceNo    541909 non-null  object
 1   StockCode    541909 non-null  object
 2   Description  540455 non-null  object
 3   Quantity     541909 non-null  int64
 4   InvoiceDate  541909 non-null  object
 5   UnitPrice    541909 non-null  float64
 6   CustomerID   406829 non-null  float64
 7   Country      541909 non-null  object
dtypes: float64(2), int64(1), object(5)
memory usage: 33.1+ MB- InvoiceNo: 주문 번호
- StockCode: 상품 코드
- Description: 상품 설명
- Quantity: 주문 수량
- InvoiceDate: 주문 날짜
- UnitPrice: 상품 가격
- CustomerID: 고객 아이디
- Country: 고객 거주지역(국가)
- .isnull().sum() : null값이 몇개 있는지 확인
pd.options.display.max_rows = 10

# 각 컬럼당 null이 몇 개 있는지 확인
retail.isnull().sum()

InvoiceNo           0
StockCode           0
Description      1454
Quantity            0
InvoiceDate         0
UnitPrice           0
CustomerID     135080
Country             0
dtype: int64
- null 값, 불필요한 데이터 처리
# 비회원을 제거(null이 없는 행만 저장)
retail = retail[pd.notnull(retail['CustomerID'])]

#'CustomerID'에 null이었던 행 사라짐 확인
len(retail)
// 406829
# 구입 수량이 0이하인 데이터를 확인
retail[retail['Quantity'] <= 0]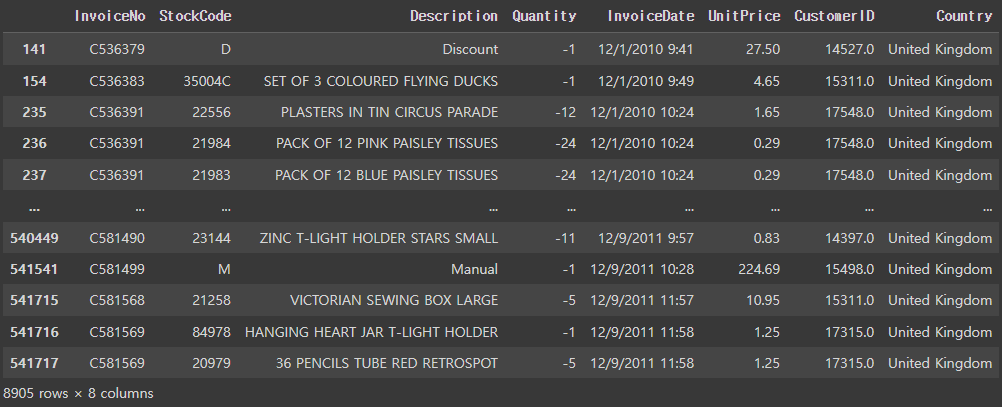
# 구입 수량이 1 이상인 데이터만 재저장
retail = retail[retail['Quantity'] >= 1]

# len으로 행 사라진 것 확인
len(retail)
// 397924
# 구입 가격이 0 이하인 데이터를 확인
retail[retail['UnitPrice'] <= 0]
# 구입 가격이 1 이상인 데이터를 저장
retail = retail[retail['UnitPrice'] > 0]
len(retail)
// 397884- 다시 데이터 정보 확인
retail.info()

<class 'pandas.core.frame.DataFrame'>
Int64Index: 397884 entries, 0 to 541908
Data columns (total 9 columns):
 #   Column         Non-Null Count   Dtype
---  ------         --------------   -----
 0   InvoiceNo      397884 non-null  object
 1   StockCode      397884 non-null  object
 2   Description    397884 non-null  object
 3   Quantity       397884 non-null  int64
 4   InvoiceDate    397884 non-null  object
 5   UnitPrice      397884 non-null  float64
 6   CustomerID     397884 non-null  float64
 7   Country        397884 non-null  object
 8   CheckoutPrice  397884 non-null  float64
dtypes: float64(3), int64(1), object(5)
memory usage: 30.4+ MB- 데이터 타입 object => date 타입으로 바꾸기
retail['InvoiceDate'] = pd.to_datetime(retail['InvoiceDate'])

retail.info()

<class 'pandas.core.frame.DataFrame'>
Int64Index: 397884 entries, 0 to 541908
Data columns (total 9 columns):
 #   Column         Non-Null Count   Dtype
---  ------         --------------   -----
 0   InvoiceNo      397884 non-null  object
 1   StockCode      397884 non-null  object
 2   Description    397884 non-null  object
 3   Quantity       397884 non-null  int64
 4   InvoiceDate    397884 non-null  datetime64[ns]   # type변환 성공 확인
 5   UnitPrice      397884 non-null  float64
 6   CustomerID     397884 non-null  float64
 7   Country        397884 non-null  object
 8   CheckoutPrice  397884 non-null  float64
dtypes: datetime64[ns](1), float64(3), int64(1), object(4)
memory usage: 30.4+ MB- 제일 많이 팔리는 판매제품 Top10
top_selling = retail.groupby('StockCode')['Quantity'].sum().sort_values(ascending=False).iloc[:10]
print(top_selling)
StockCode
23843     80995
23166     77916
84077     54415
22197     49183
85099B    46181
85123A    36782
84879     35362
21212     33693
23084     27202
22492     26076
Name: Quantity, dtype: int64- checkoutPrice기준 우수고객 Top10
vip = retail.groupby('CustomerID')['CheckoutPrice'].sum().sort_values(ascending=False).head(10)
vip
CustomerID
14646.0    280206.02
18102.0    259657.30
17450.0    194550.79
16446.0    168472.50
14911.0    143825.06
12415.0    124914.53
14156.0    117379.63
17511.0     91062.38
16029.0     81024.84
12346.0     77183.60
Name: CheckoutPrice, dtype: float64- 나라별 매출 구하기
# 전체 매출 확인
total_revenue = retail['CheckoutPrice'].sum()
total_revenue
# 각 나라별 구매 횟수
retail['Country'].value_counts()# 국가별 매출
rev_by_countries = retail.groupby('Country')['CheckoutPrice'].sum().sort_values()
Country
Saudi Arabia 145.920
Bahrain 548.400
Czech Republic 826.740
RSA 1002.310
Brazil 1143.600
...
France 209024.050
Germany 228867.140
EIRE 265545.900
Netherlands 285446.340
United Kingdom 7308391.554
Name: CheckoutPrice, Length: 37, dtype: float64# pandas도 matplotlib 기능이 어느정도 있음
plot = rev_by_countries.plot(kind='bar', figsize=(20, 10))
plot.set_xlabel('Country', fontsize=12)
plot.set_ylabel('Revenue', fontsize=12)
plot.set_title('Revenue By Country', fontsize=15)
plot.set_xticklabels(labels=rev_by_countries.index, rotation=45)
# 나라별 매출/ 총 매출 >> 나라별 매출이 차지하는 비율
rev_by_countries / total_revenue

Country
Saudi Arabia      0.000016
Bahrain           0.000062
Czech Republic    0.000093
RSA               0.000112
Brazil            0.000128
                    ...
France            0.023456
Germany           0.025682
EIRE              0.029798
Netherlands       0.032032
United Kingdom    0.820116
Name: CheckoutPrice, Length: 37, dtype: float64- 월별 매출 구하기
retail['InvoiceDate'].sort_values(ascending=False)

541908   2011-12-09 12:50:00
541901   2011-12-09 12:50:00
541895   2011-12-09 12:50:00
541896   2011-12-09 12:50:00
541897   2011-12-09 12:50:00
                 ...
3        2010-12-01 08:26:00
1        2010-12-01 08:26:00
5        2010-12-01 08:26:00
6        2010-12-01 08:26:00
0        2010-12-01 08:26:00
Name: InvoiceDate, Length: 397884, dtype: datetime64[ns]
# 년도와 월로 groupby 후 매출의 합 구함
retail.groupby([retail['InvoiceDate'].dt.year,retail['InvoiceDate'].dt.month])['CheckoutPrice'].sum()
InvoiceDate InvoiceDate
2010 12 572713.890
2011 1 569445.040
2 447137.350
3 595500.760
4 469200.361
...
8 645343.900
9 952838.382
10 1039318.790
11 1161817.380
12 518192.790
Name: CheckoutPrice, Length: 13, dtype: float64# 년도와 월 이름 변경하는 함수
def extract_month(date): # 2011-12-09 12:50:00
month = str(date.month) #12
if date.month < 10:
month = '0' + month # 01
return str(date.year) + month #201112✔ groupby 안에 extrack_month 함수를 넣은 모습입니다.
rev_by_month = retail.set_index('InvoiceDate').groupby(extract_month)['CheckoutPrice'].sum()

InvoiceDate
201012     572713.890
201101     569445.040
201102     447137.350
201103     595500.760
201104     469200.361
             ...
201108     645343.900
201109     952838.382
201110    1039318.790
201111    1161817.380
201112     518192.790
Name: CheckoutPrice, Length: 13, dtype: float64
https://pandas.pydata.org/docs/reference/api/pandas.DataFrame.groupby.html#pandas.DataFrame.groupby
pandas.DataFrame.groupby — pandas 2.1.4 documentation
Split along rows (0) or columns (1). For Series this parameter is unused and defaults to 0. Deprecated since version 2.1.0: Will be removed and behave like axis=0 in a future version. For axis=1, do frame.T.groupby(...) instead.
pandas.pydata.org
groupby 메서드의 by 매개변수가 함수일 경우 해당 객체의 인덱스의 각 값에 대해 groupby가 호출됩니다.
# 요일별 매출 구하기
def extract_dow(date):
    return date.dayofweek

rev_by_dow= retail.set_index('InvoiceDate').groupby(lambda date: date.dayofweek)['CheckoutPrice'].sum()
InvoiceDate
0    1367146.411
1    1700634.631
2    1588336.170
3    1976859.070
4    1485917.401
6     792514.221
Name: CheckoutPrice, dtype: float64
import numpy as np
# 요일은 0~6으로 변환되기 때문에 요일 이름으로 변경해주기
DAY_OF_WEEK = np.array(['Mon', 'Tue', 'Web',"Thur", ' Fri', 'Sat', 'Sun'])
# rev_by_dow의 인덱스 = DAY_OF_WEEK[0~6]
rev_by_dow.index = DAY_OF_WEEK[rev_by_dow.index]
rev_by_dow.index // Index(['Mon', 'Tue', 'Web', 'Thur', ' Fri', 'Sun'], dtype='object')
rev_by_dow
Mon 1367146.411
Tue 1700634.631
Web 1588336.170
Thur 1976859.070
Fri 1485917.401
Sun 792514.221
Name: CheckoutPrice, dtype: float64plot_bar(rev_by_dow, 'DOW', 'Revenue', 'Revenue By DOW')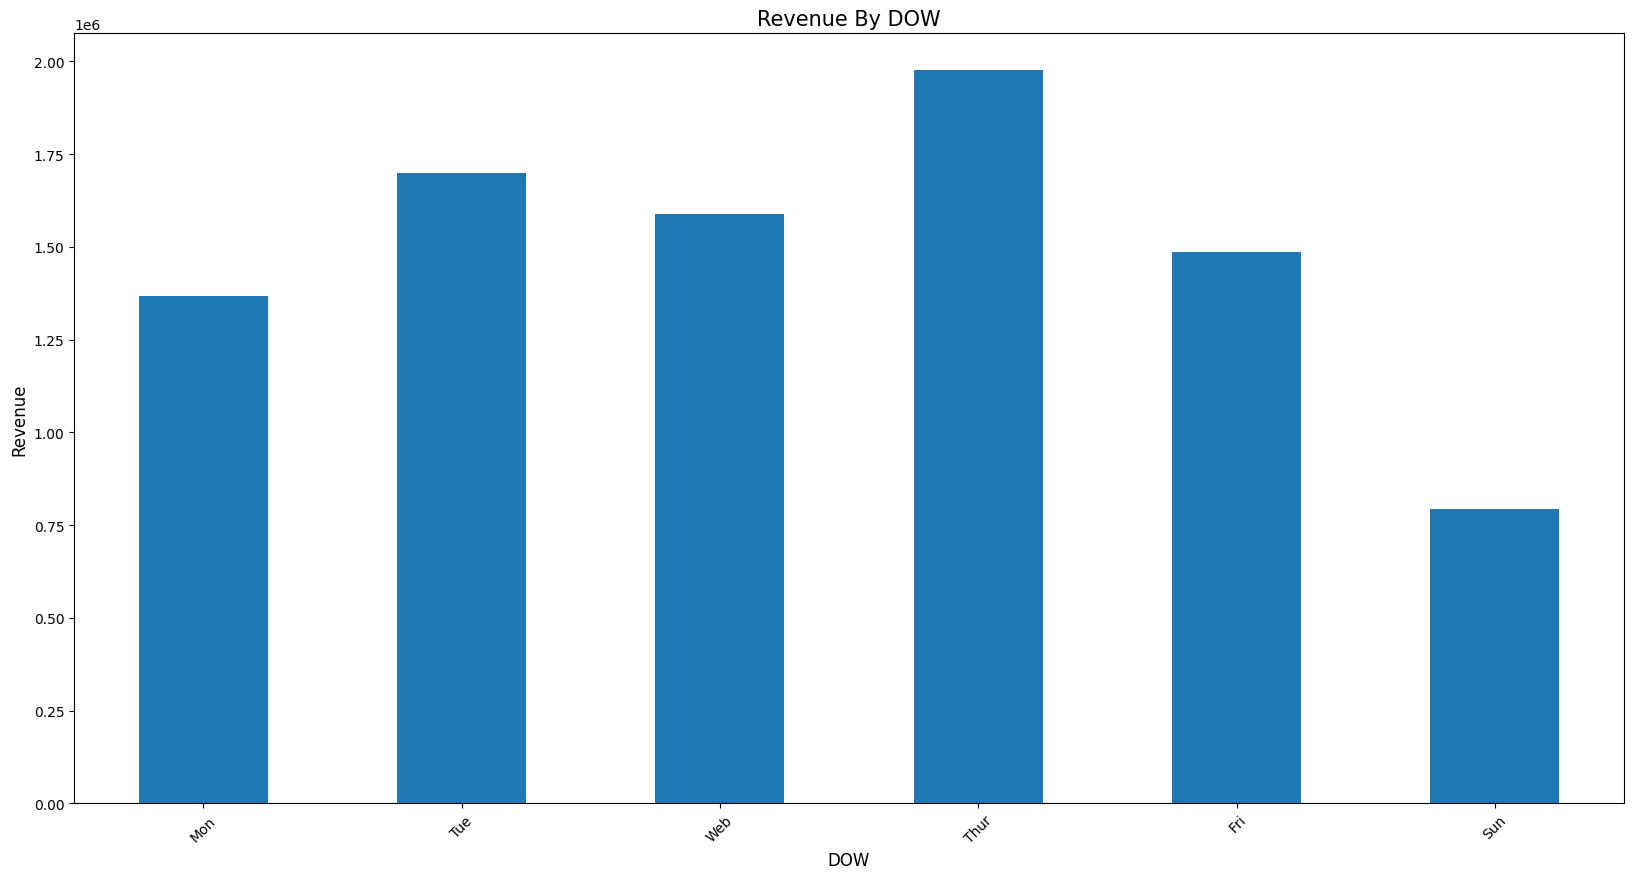
# 시간대별 매출 구하기
rev_by_hour= retail.set_index('InvoiceDate').groupby(lambda date: date.hour)['CheckoutPrice'].sum()

print(rev_by_hour)
InvoiceDate
6           4.250
7       31059.210
8      282115.630
9      842605.171
10    1261192.571
         ...
16     468885.800
17     234413.521
18     104954.430
19      49028.460
20      18932.760
Name: CheckoutPrice, Length: 15, dtype: float64
plot_bar(rev_by_hour, 'Hour', 'Revenue', 'Revenue By Hour')
데이터로부터 통찰한 결과
* 전체 매출의 약 82%가 UK에서 발생
* 매출은 꾸준히 성장하는 것으로 예상
(11년 12월 데이터는 9일까지만 포함)
* 토요일은 영업을 하지 않음
* 새벽 6시에 오픈, 오후 9시에 마감이 예상
* 일주일 중 목요일까지는 성장세를 보이고 이후 하락
* 점심시간대 매출이 높음
'데이터 분석' 카테고리의 다른 글
| boxplot / 따릉이 실시간 데이터 예제 (0) | 2023.12.24 |
|---|---|
| 상권별 업종 밀집 통계 예제 (0) | 2023.12.23 |
| Matplotlib (0) | 2023.12.10 |
| 판다스3 (0) | 2023.12.08 |
| 판다스2 (0) | 2023.12.08 |


